Frequently Asked Questions
The numbers in the meters occasionally change colors when the bar is full. Is this a bug?
No, that's the expected behavior. :) It's like when progress bars fill over the number on GUI apps.
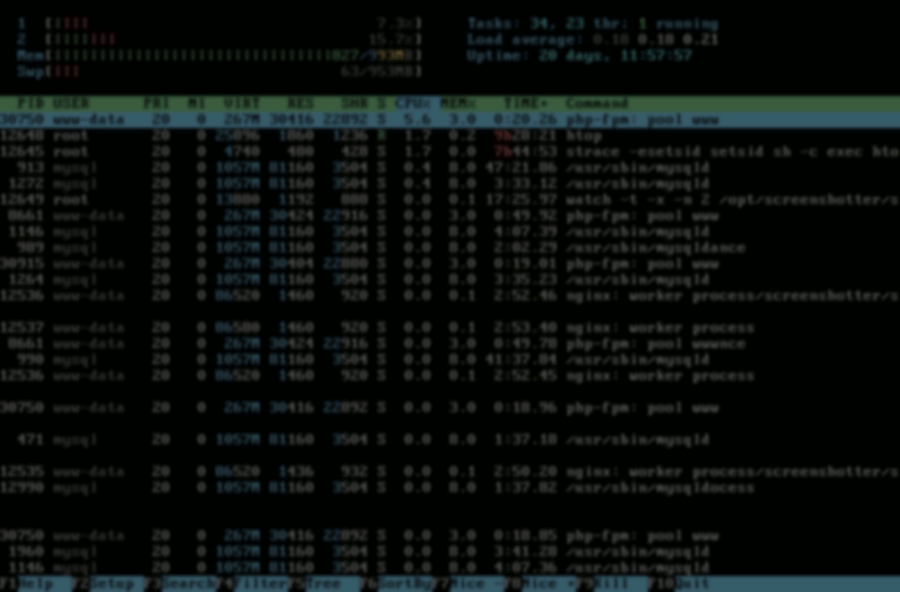
The memory meter in htop says a low number, such as 9%, when top shows something like 90%! (Or: the MEM% number is low, but the bar looks almost full. What's going on?)
The number showed by the memory meter is the total memory used by processes. The additional available memory is used by the Linux kernel for buffering and disk cache, so in total almost the entire memory is in use by the kernel. I believe the number displayed by htop is a more meaningful metric of resources used: the number corresponds to the green bars; the blue and brown bars correspond to buffers and cache, respectively (as explained in the Help screen accessible through the F1 key). Numeric data about these is also available when configuring the memory meter to display as text (in the Setup screen, F2).
Why doesn't htop feature a SWAP column, like top?
It is not possible to get the exact size of used swap space of a process. Top fakes this information by making SWAP = VIRT - RES, but that is not a good metric, because other stuff such as video memory counts on VIRT as well (for example: top says my X process is using 81M of swap, but it also reports my system as a whole is using only 2M of swap. Therefore, I will not add a similar Swap column to htop because I don't know a reliable way to get this information (actually, I don't think it's possible to get an exact number, because of shared pages).
How can I be notified of new releases?
You can join the htop mailing list!
What does the 'h' in 'htop' stand for?
Yes, I did receive emails asking this! :)
Well, the short explanation is a little obvious: the "h" stands
for "Hisham", my name. :)
The long explanation is that what inspired me to write htop was
pinfo,